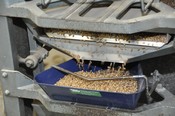
Milling / Baking Lab


|
 |
|
Description of Wheat Quality Factors
WHEAT ANALYSIS
- Moisture % - Water content in the wheat is inversely related to the amount of dry matter. Dry wheat can be kept for years if properly stored, but wet wheat may deteriorate dramatically.

|
 |
 |
- Protein % (12% MB) - Ranges from 6% to 20%, depending on variety, class, environmental conditions and cultural practices during growth. Rainfall during kernel development results in low protein, whereas dry conditions during development usually results in high protein. 1 to 1.5% of protein is lost when the wheat is milled into flour.
Ash % - Mineral content in the wheat. Bran has higher ash content than flour. Small or shriveled kernels have more bran on a percentage basis and therefore more crude fiber and ash than large, plump kernels and consequently yield less flour. Wheat usually contains 1.4 to 2% ash at 14% moisture basis.
Test Weight (lb/bu) - Wheat weight per unit volume. Most widely used and simplest criteria of wheat. Rough index of flour yield.
Wheat Hardness (NIR) - A means of determining hard and soft wheat kernels. The higher the hardness the higher the absorption.
1000 Kernel Wt. (g) - Function of kernel size, shape, dryness, purities and density and also an index of potential milling yield.
FLOUR ANALYSIS
Moisture % - Flour Moisture content is usually in the range of 12-15%, and under these conditions, lipid degradation is not a problem in the short to medium term, but at higher moisture contents, rapid hydrolysis of lipids by proliferating molds seriously lowers flour baking quality.
Protein % - 1 to 1.5% of protein is lost when the wheat is milled into flour.
Ash % - A highly significant correlation is found between ash content and the brightness of flour. For any given wheat, higher extraction produces darker flours with higher ash content.
Falling Number (Sec) - A measure of the alpha-amylase activity (starch liquefied enzyme). With more alpha-amylase, degradation of starch is greater and starch viscosity decreases, giving a decreased falling number. A falling number of 300 and above is desirable.
Wet Gluten % (14% MB) - 10 g flour and 5 ml 2% salt solution are used to produce a wet gluten doughball. The wet gluten is isolated by washing this dough with a sodium chloride solution. The residual water adherent to the gluten is removed by centrifugation and the remainder weighed.
EXPERIMENTAL MILLING
- Flour Yield % - Proportion of wheat recovered as flour by the process of milling, expressed as a percent.
FARINOGRAPH
- A physical dough testing instrument is used to measure plasticity or rheology and mobility of dough when subjected to mixing action.
Absorption % - Percentage of water required to center the curve on the 500 Brabender Unit line at the maximum consistency of the dough. Because flours vary in "slacking out" during fermentation, this may not be the true absorption in the bakery. The preference is for higher absorption percentages.
Arrival (Min) -The time curve takes to reach 500 B.U. line.
Mixing Peak (Min) - The time required for the curve to reach its full development or maximum consistency, long peak times usually associated with strong wheat.
Departure (Min) - The time curve takes to drop below 500 B.U. line.
M.T.I. (B.U.) - Mixing tolerance index - Difference in B.U. from the top of the curve at the peak to the top of the curve measured at 5 minutes after the peak is reached.
M.T. (Min) -Stability of Farinograph curve, Departure - Arrival
T.M.D. (B.U.) - Difference in B.U. from the 500 B.U. line to the center of the curve calculated at 20 minutes from the addition of the water.
Valorimeter - A numerical value based on a logarithmic function of the peak time in relation to the breakdown 12 minutes after peak time. Higher values indicate a stronger flour and lower values indicate a weaker flour.
5. BREAD PROCESSING TEST
- Volume c.c. - Measures rapeseed displacement. Bread volume weight is measured immediately after bread loaf is out of the oven.
Sp. Volume c.c/g - Volume of loaf divided by weight.
Grain & Texture - Grain texture is objective score using E, S, S-Q, Q, U.
Score Number - 1-5 based on prior factors in bake test. (5 is excellent)
ALVEOGRAPH
- W - Surface of the recording curve linked to the energy required to deform the sample (force).
P/L - Ratio Measure of resistance and extensibility or configuration of the curve.
Excellent = E, Satisfactory = S, Satisfactory-Questionable = S-Q, Questionable = Q, Unsatisfactory = U

|
|
|